
Recruitment metrics and analytics are powerful tools for measuring the effectiveness and success of your recruitment funnel. But while the theory behind HR analytics and HR metrics is well understood, putting that theory into practice can be a challenge. What we need to uncover is which specific aspects of our hiring process can be improved, how to make those improvements, and, most importantly, how to gain the actionable insights that drive real transformation in recruitment performance.
What is HR Analytics?
HR analytics, also known as people analytics or talent analytics, refers to the process of collecting, analyzing, and interpreting data related to the workforce and various HR processes. It enables HR professionals to make informed decisions based on data rather than intuition, ultimately leading to more effective human resource management.
At its core, HR analytics focuses on understanding patterns and trends in employee behavior, performance, and organizational outcomes. By leveraging data, HR teams can uncover valuable insights into measuring recruitment effectiveness, employee engagement, turnover rates, and other key metrics.
To streamline and scale HR analytics efforts, organizations often rely on specialized tools and platforms such as:
- Applicant Tracking Systems (ATS) – for analyzing recruitment metrics and hiring funnel performance
- Human Resource Information Systems (HRIS) – to centralize and analyze employee data
- Business Intelligence tools like Power BI or Tableau, for advanced visualizations and reporting
- Predictive analytics platforms – for forecasting attrition, hiring needs, and productivity trends
Why Do We Need HR Analytics?
Making data-backed decisions in HR is no longer optional; it’s essential. Relying solely on gut feeling or outdated practices can lead to inefficiencies, missed opportunities, and costly mistakes.
By using HR analytics, organizations can:
- Improve recruitment by identifying what works and what doesn’t in the hiring process
- Enhance employee engagement by recognizing drivers of satisfaction and motivation
- Increase retention by spotting early signs of disengagement or burnout
Some of the most notable benefits of HR analytics include:
- Reducing hiring costs through smarter sourcing and faster time-to-hire
- Identifying skill gaps to shape training and development strategies
- Aligning HR efforts with business objectives, ensuring every HR initiative supports broader organizational goals
What are HR Metrics?
HR metrics are quantitative measurements used to track the performance and efficiency of various human resource functions. These metrics provide a clear, data-driven view of how well HR initiatives are supporting organizational goals, from hiring and onboarding to employee retention and engagement.
While HR metrics and analytics are closely connected, they serve different purposes. Metrics provide the raw numbers, such as time-to-hire, turnover rate, or cost-per-hire, whereas analytics go a step further by interpreting those numbers to uncover trends, root causes, and actionable insights.
Why Do We Need HR Metrics?
HR departments need measurable benchmarks to evaluate their efforts and drive continuous improvement. Without consistent tracking, it’s difficult to know what’s working, where adjustments are needed, or how HR is contributing to broader business objectives.
By using well-defined metrics, HR teams can:
- Monitor progress and spot inefficiencies in real time
- Optimize strategies across recruitment, development, and retention
- Provide leadership with clear evidence of HR’s impact
- Support performance reviews with objective data
- Improve the recruitment funnel by identifying drop-off points or delays
- Contribute meaningfully to long-term strategic planning
In short, HR metrics help transform workforce management from a reactive function to a strategic business partner.
Data-Driven Hiring with HR Analytics and Metrics
Access to relevant data helps recruiters make informed hiring decisions throughout the hiring process—whether that relates to the hiring budget, what to give their attention to, or optimizing the recruitment funnel. Not only do global trends show that we are now living in a data-driven world, but recruiting trends also point to the fact that data-driven hiring is truly indispensable. In fact, benchmarking HR metrics such as time-to-hire and cost-per-hire allows organizations to better evaluate and refine their strategies. 94% of recruiters and hiring professionals say that recruitment software positively impacts their hiring process.
How to Get Started with HR Analytics and Reporting
Before getting into all the different recruitment metrics and analytics that you should be tracking and working with, it is important to first know how you can acquire these analytics. While you can manually keep count of recruitment metrics and analytics, the process can get overwhelming and lead to a vast amount of sunken time. That’s why it is optimal to leverage HR analytics and reporting software, which will be able to gather all the relevant data and provide you with all the relevant reports needed to make informed hiring decisions.
With recruitment software, you can host a sophisticated database, which stores all the relevant data that you will need to:
- Review candidates
- Search, filter, and sort
- Make day-to-day hiring decisions
- Compile advanced reports
You are essentially delegating the task of data entry and analysis to your software and concentrating your time on more of your critical duties as a recruiter. Overall, implementing recruitment software into your hiring process can help save 20% of recruiters’ time.
Key Recruitment Metrics and Analytics to Track
To build a strong and efficient hiring process, it’s essential to track the right recruitment metrics and use analytics to interpret them. These data points provide visibility into each stage of the hiring funnel, helping HR teams identify bottlenecks, improve candidate experiences, and make smarter hiring decisions. By consistently monitoring these metrics, organizations can reduce time and cost per hire while increasing the quality of candidates. When paired with analytics, these numbers reveal deeper trends and patterns that can guide long-term talent acquisition strategies.
Time per fill
Time per fill is the time passed from the opening of a job to it being filled. It’s a useful metric for more than one reason. Firstly, the metric can be used before the opening of a position as a sort of indication or expectation for when a job would be filled if it were to be opened that day. With this insight, employers can adjust their approach to a new job opening. For example, if a position needs to be filled more urgently, HR might take the initiative to speed up the recruitment process if the projected time per fill does not satisfy the organization’s needs. You can also use it as an indicator of productivity. If the time per fill has changed noticeably, you might want to look into why that is. What has changed about the recruitment process that has prompted such an increase/decrease in the time per fill? Is this good or bad? These are the sort of questions you want to be answering when looking at your recruitment analytics.
Overall, it’s an important metric that you would want to keep an eye on, either as one of your recruitment KPIs or simply as a metric to be aware of when wanting to know what to expect from the hiring process. This is one of the many metrics that define your hiring process, and it’s one you definitely should be tracking, whatever type of company you are.
Time to hire
Time to hire is the time passed from the entry of a candidate into the pipeline to accepting the job offer. How this differs from the time per fill is that it only counts the time after the candidate who got the job entered the pipeline.
What time to hire indicates the time it takes for candidates to move through your hiring process. Too long and your candidates may receive offers from other employers or simply drop out. Too short, and you may not be applying the proper protocols in assessing your candidates.
So while the time per fill metric may give you insights into the entire recruitment process, the time to hire is a good metric to monitor the health of your recruitment funnel and different hiring stages.
Cost per hire
Cost per hire is the sum of all the costs incurred when making a new hire. The metric is calculated by taking all the recruitment costs incurred for a certain period and dividing it by the number of hires made. The costs can vary depending on the recruitment procedures used by the employer, but the most common costs to keep track of include:
- Job distribution costs. The costs incurred for distributing the jobs on job boards or placing advertisements.
- Sourcing costs. The costs incurred throughout the candidate sourcing process include access to talent databases.
- Pre-screening costs. Some employers may decide to run background checks and have their applicants complete assessments and tests to verify their knowledge.
- Software costs. Most HR will use recruitment software for their hiring, and this comes with the associated subscription and add-on costs.
- Labor costs. Varying by company, you may or may not want to include labor costs in your calculations. However, this is a pretty significant cost and will paint a better picture if included in the cost per hire.
- Other costs. Employers can have many other associated costs with their recruitment. Whether it’s employer branding, career fairs, or any other costs, not every employer will have similar cost structure.
The cost per hire is an extremely important metric. It shows what the hiring budget looks like and breaks down all the costs incurred from the hiring process. The costs need to be broken down, as when employers need to increase or decrease their hiring budget, they will have to look at exactly which department they can do so effectively.
Visibility metrics
Visibility metrics provide key information for employers to assess their recruitment marketing and job distribution efforts. They tell you how many people have seen your employment opportunities across all your different campaigns.
These metrics are key for assessing the effectiveness of recruitment marketing campaigns and can be used as a KPI. For example, if your visibility is good, but your number of applicants is low or non-existent, this might give you insight that your recruitment campaign needs improvement in other areas.
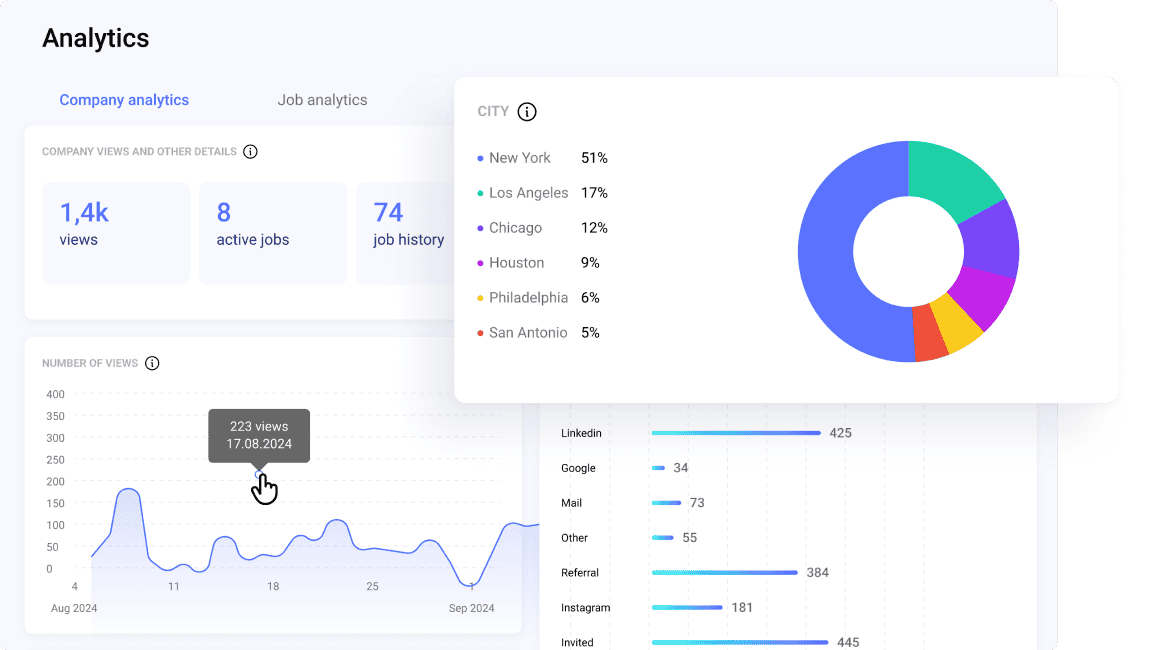
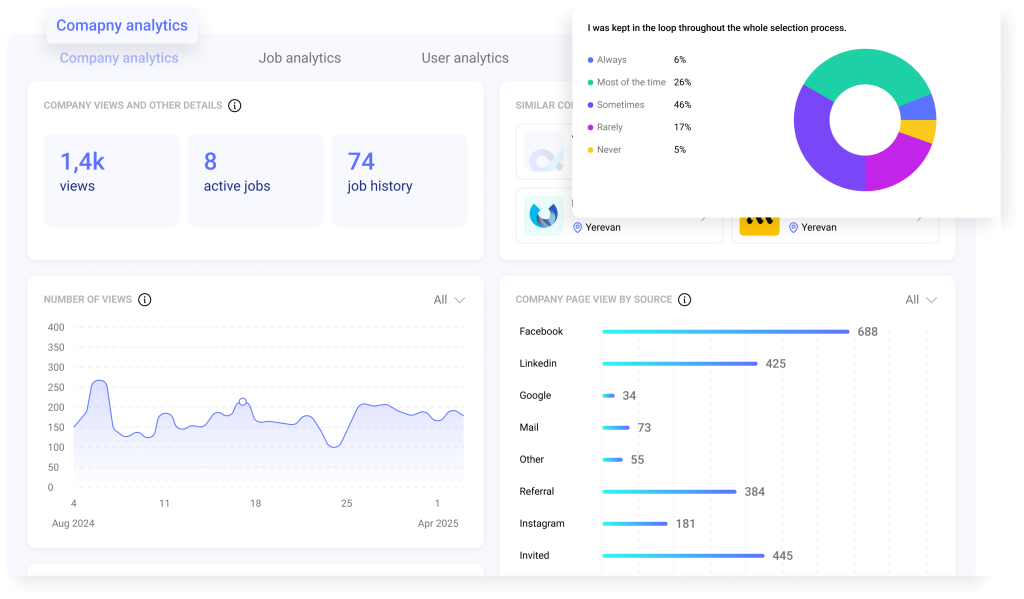
Company views
This analytics shows the total amount of views your job posts are getting across the board. You can track your visibility across all channels and vacancies, and track the overall performance of your recruitment marketing efforts over time.
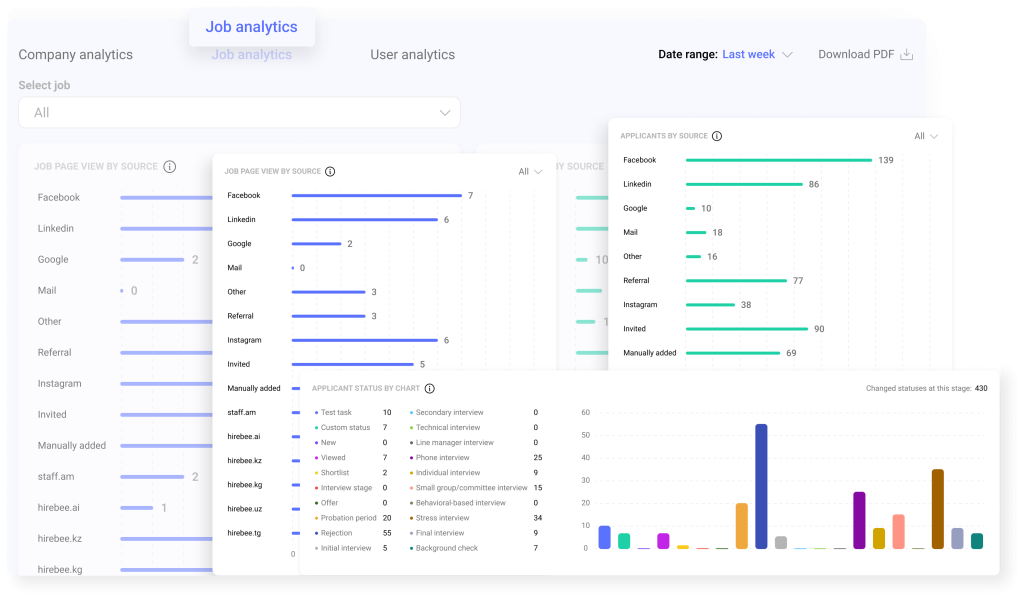
Job views
This analytics shows the number of views a specific job position is getting across all distribution channels. This is a great way to track the performance of your jobs and identify which recruitment campaigns were a success and which were not.
Source metrics
Candidate source metrics provide employers with the key information needed to assess the effectiveness of their different recruitment channels. By separating your analytics by source, you can get a better overall picture of exactly where you are failing and where you are succeeding.
Applicants per source
Knowing exactly how the number of your applicants is divided between your different sources helps you track their effectiveness. For example, you may find that Indeed is not a particularly good source for one of your positions, while it performs extraordinarily well for another position. It’s important to know this to be able to better distribute your hiring budget and not waste time or money distributing to channels that are not effective.
Views per source
Meanwhile, views per source give a more indirect look into the effectiveness of your sourcing channels. There are different ways you can interpret this analytics, but it is usually compared with the applicants per source metric, where you can speculate what the situation with a specific source is.
| High applicants | Low applicants | |
| High views | Extremely effective source | Ineffective source, but can be effective for other jobs |
| Low views | Effective source but cannot be relied upon as the main source | Extremely ineffective source |
Pipeline metrics
Candidate pipeline metrics provide employers with key information needed to assess the health and effectiveness of their pipeline. It allows you to dig deeper into the effectiveness of your recruitment funnel and directs you toward a culprit when you are looking to optimize your campaigns.
Applicants per hiring stage
This simple metric gives you a view of what your pipeline is looking like and can direct you towards which candidates need to be reviewed. Additionally, you can track over time how effective your candidate screening and evaluation processes were by tracking what percentage of candidates made it into their designated hiring stages.
Time per hiring stage
Time per hiring stage further dissects into your time to hire. With this metric, you can track how much time candidates spend on average in each hiring stage. This can give you all the pointers and the time to hire, except it’s more detailed and gives you more precise answers.
Turnover Rate
The turnover rate is a metric that provides the number of individuals who bid farewell within a designated span. It offers a glimpse into the effectiveness of your hiring practices and the grace of your onboarding processes. Moreover, it delves deeper, shedding light on the overall work environment. A high turnover rate can signal disharmony, urging us to reevaluate our approaches. A low rate tells about contentment, implying that employees find resonance within the company’s methods. This metric doesn’t just depict departures, but shows organizational culture, urging us to seek alignment between our values and the experiences we provide.
Employee Referral Rate
In the landscape of modern workplaces, the employee referral rate measures the number of new hires that emerge through the recommendation of existing team members. A high employee referral rate isn’t just numerical; it’s a testament to a work environment where individuals feel valued and invested. It’s the embodiment of a collective voice that says, “This is a place worth sharing.” As this metric climbs, it shows stories of teamwork and collaboration, fostering a sense of community that resonates far beyond the numbers.
Time-to-Productivity
In the choreography of successful onboarding, the rhythm of time-to-productivity takes center stage, revealing how swiftly new hires waltz into their roles with confidence. This metric measures the interval between a candidate’s entry and the moment they confidently embrace their responsibilities. A shorter time-to-productivity isn’t just a quick transition. It speaks about the effectiveness of your training programs and the seamless integration of new members. This metric hints at the harmony between well-designed onboarding processes and a new hire’s journey toward full-fledged productivity.
Conclusion
In today’s competitive talent landscape, leveraging HR analytics and metrics is no longer optional—it’s essential. These tools play a vital role in building data-driven, cost-effective, and efficient hiring strategies that align with overall business goals. By understanding and acting on the right data, HR teams can optimize every stage of the recruitment process, from sourcing to onboarding.
Tracking the right recruitment metrics enables smarter, evidence-based decision-making, reduces employee turnover, and improves overall hiring quality. To fully unlock these benefits, HR departments should invest in reliable analytics and reporting software, enabling them to move from reactive hiring to proactive talent management. With the right insights in hand, HR can lead the way in building stronger, more resilient teams.
Register for a demo with us to get a glimpse of what you have been missing >> Register for a demo – Hirebee